1Last calculated NAV. Concurrently with the suspension of redemption of units of the Trust, initiated on August 18, 2025, Trez Capital Fund Management Limited Partnership has suspended the calculation of NAV.
2Estimated total distributions based on F Series units as of May 31, 2026. 2026 return is before the payment of the year-end top up, if any, distributed in March 2027. Assumes distributions are reinvested. Distributions may consist of income and gains of the Trust and/or a return of capital (ROC).
3Based on audited annualized returns as at December 31, 2025.

| Fund Type | Open-Ended pooled mortgage fund |
| FundServ Code | |
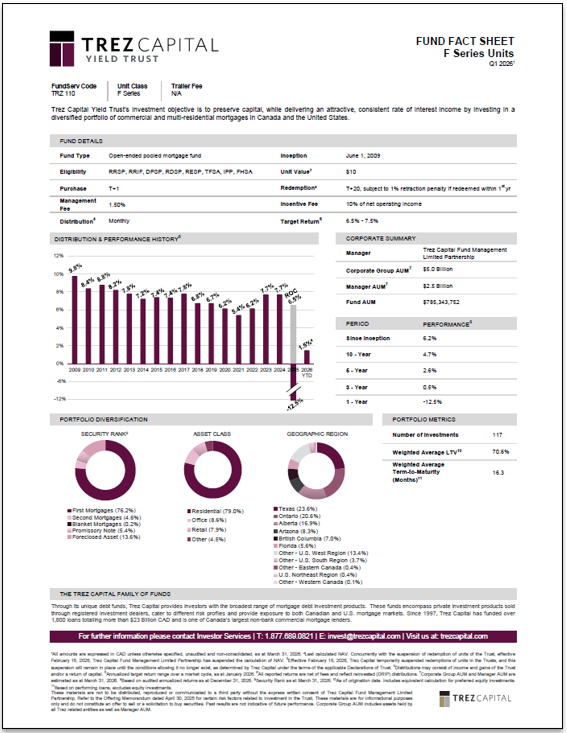
| F Series | TRZ 110 |
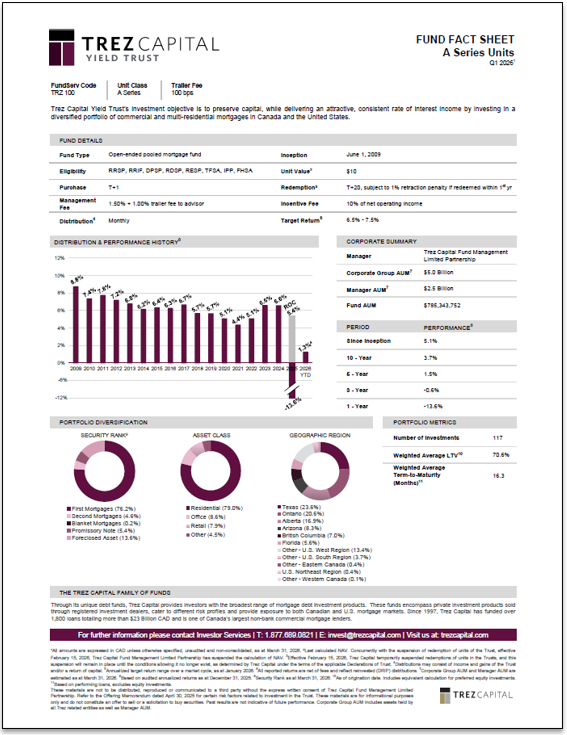
| A Series | TRZ 100 |
| Inception | June 1, 2009 |
| Eligibility | RRSP, RRIF, DPSP, RDSP, RESP, TFSA, IPP, FHSA |
| Unit Value | N/A1 |
| Purchase | T+1 |
| Redemption | T+20, subject to 1% retraction penalty if redeemed within 1st year |
| Management Fee | 1.50% |
| Incentive Fee | 10% of Net Operating Income |
| Distribution Frequency | Monthly |
| Manager | Trez Capital Fund Management Limited Partnership |
| Corporate Group AUM2 | $5.0 Billion CAD |
| Manager AUM | $2.5 Billion CAD |
| Fund AUM | $785,343,752 CAD |
| Number of Investments | 117 |
| Weighted Average LTV4 | 70.6% |
| Weighted Average Term-to-Maturity (Months)5 | 16.3 |
1Corporate Group AUM and Manager AUM are estimated as at March 31, 2026.
2Corporate Group AUM includes assets held by all Trez related entities as well as Manager AUM.
3Unaudited and non-consolidated, as at March 31, 2026.
4As of origination date. Includes equivalent calculation for preferred equity investments.
5Based on performing loans, excludes equity investments.
6Security rank as at March 31, 2026.
All reported returns are net of fees and reflect reinvested (DRIP) distributions.
*Due to the inception of the fund in June 2009, the return for 2009 is an annualized return.
**Distributions may consist of income and gains of the Trust and/or a return of capital. Estimated total distributions based on YTD 2025 distributions, plus projected remaining distributions calculated using the March 31, 2026, distribution rate.
***As at March 31, 2026.
| Performance1 | 1 – Year | 3 – Year | 5 – Year | 10 – Year | Since Inception |
|---|---|---|---|---|---|
| Trez Capital Yield Trust Series F | -12.5% | 0.5% | 2.6% | 4.7% | 6.2% |
| Trez Capital Yield Trust Series A2 | -13.6% | -0.6% | 1.5% | 3.7% | 5.1% |
Trez Capital Yield Trust distributes1 100% of its net income annually. Unitholders receive monthly distributions at a rate of 0.500% on Series F units and 0.417% on Series A units. An investor may be eligible for an additional annual top-up distribution, which is paid in mid-March following the conclusion of the annual audit of the Trust.
2026 Trez Capital Monthly Distributions
Year Series3 Jan Feb Mar Apr May Jun Jul Aug Sep Oct Nov Dec Top-
up4YTD
DistributionYTD Distribution Rate5
2026 A $0.0417 $0.0417 $0.0417 $0.0417 $0.0417 – – – – – – – – $0.2083 2.101%
F $0.0500 $0.0500 $0.0500 $0.0500 $0.0500 – – – – – – – – $0.2500 2.525%
Historical Distributions6
Year Series3 Jan Feb Mar Apr May Jun Jul Aug Sep Oct Nov Dec Top-
up4Annual
DistributionAnnualized Distribution Rate7
2025 A $0.0505 $0.0463 $0.0463 $0.0463 $0.0463 $0.0463 $0.0417 $0.0417 $0.0417 $0.0417 $0.0417 $0.0417 – $0.5318 5.449%
F $0.0588 $0.0546 $0.0546 $0.0546 $0.0546 $0.0546 $0.0500 $0.0500 $0.0500 $0.0500 $0.0500 $0.0500 – $0.6317 6.503%
2024 A $0.0557 $0.0557 $0.0557 $0.0557 $0.0557 $0.0557 $0.0557 $0.0505 $0.0505 $0.0505 $0.0505 $0.0505 – $0.6422 6.614%
F $0.0640 $0.0640 $0.0640 $0.0640 $0.0640 $0.0640 $0.0640 $0.0588 $0.0588 $0.0588 $0.0588 $0.0588 – $0.7420 7.678%
2023 A $0.0517 $0.0517 $0.0517 $0.0517 $0.0517 $0.0517 $0.0557 $0.0557 $0.0557 $0.0557 $0.0557 $0.0557 $0.0000 $0.6440 6.633%
F $0.0600 $0.0600 $0.0600 $0.0600 $0.0600 $0.0600 $0.0640 $0.0640 $0.0640 $0.0640 $0.0640 $0.0640 $0.0000 $0.7440 7.699%
2022 A $0.0347 $0.0347 $0.0347 $0.0347 $0.0347 $0.0417 $0.0442 $0.0442 $0.0442 $0.0467 $0.0467 $0.0467 $0.0125 $0.5001 5.117%
F $0.0430 $0.0430 $0.0430 $0.0430 $0.0430 $0.0500 $0.0525 $0.0525 $0.0525 $0.0550 $0.0550 $0.0550 $0.0125 $0.6000 6.168%
2021 A $0.0417 $0.0417 $0.0347 $0.0347 $0.0347 $0.0347 $0.0347 $0.0347 $0.0347 $0.0347 $0.0347 $0.0347 $0.0000 $0.4300 4.386%
F $0.0500 $0.0500 $0.0430 $0.0430 $0.0430 $0.0430 $0.0430 $0.0430 $0.0430 $0.0430 $0.0430 $0.0430 $0.0000 $0.5300 5.431%
2020 A $0.0417 $0.0417 $0.0417 $0.0417 $0.0417 $0.0417 $0.0417 $0.0417 $0.0417 $0.0417 $0.0417 $0.0417 $0.0000 $0.5000 5.116%
F $0.0500 $0.0500 $0.0500 $0.0500 $0.0500 $0.0500 $0.0500 $0.0500 $0.0500 $0.0500 $0.0500 $0.0500 $0.0000 $0.6000 6.168%
2019 A $0.0417 $0.0417 $0.0417 $0.0417 $0.0417 $0.0417 $0.0417 $0.0417 $0.0417 $0.0417 $0.0417 $0.0417 $0.0560 $0.5560 5.689%
F $0.0500 $0.0500 $0.0500 $0.0500 $0.0500 $0.0500 $0.0500 $0.0500 $0.0500 $0.0500 $0.0500 $0.0500 $0.0560 $0.6560 6.743%
Year Series3 Q1 Q2 Q3 Q4 Quarterly
DistributionTop-
up4Annual
DistributionAnnualized
DRIP Return7
2018 A $0.125 $0.125 $0.125 $0.125 $0.500 $0.060 $0.560 5.706%
F $0.150 $0.150 $0.150 $0.150 $0.600 $0.060 $0.660 6.750%
2017 A $0.125 $0.125 $0.125 $0.125 $0.500 $0.157 $0.657 6.700%
F $0.150 $0.150 $0.150 $0.150 $0.600 $0.157 $0.757 7.800%
2016 A $0.125 $0.125 $0.125 $0.125 $0.500 $0.118 $0.618 6.300%
F $0.150 $0.150 $0.150 $0.150 $0.600 $0.118 $0.718 7.350%
2015 A $0.125 $0.125 $0.125 $0.125 $0.500 $0.125 $0.625 6.369%
F $0.150 $0.150 $0.150 $0.150 $0.600 $0.125 $0.725 7.416%
2014 A $0.125 $0.125 $0.125 $0.125 $0.500 $0.107 $0.607 6.186%
F $0.150 $0.150 $0.150 $0.150 $0.600 $0.107 $0.707 7.232%
2013 A $0.125 $0.125 $0.125 $0.125 $0.500 $0.159 $0.659 6.805%
F $0.150 $0.150 $0.150 $0.150 $0.600 $0.159 $0.759 7.805%
2012 A $0.125 $0.125 $0.125 $0.125 $0.500 $0.201 $0.701 7.216%
F $0.150 $0.150 $0.150 $0.150 $0.600 $0.201 $0.801 8.216%
2011 A n/a $0.125 $0.125 $0.125 $0.375 $0.259 $0.634 7.789%
F $0.150 $0.150 $0.150 $0.150 $0.600 $0.259 $0.859 8.789%
2010 F $0.150 $0.150 $0.150 $0.150 $0.600 $0.220 $0.820 8.391%
2009 F n/a $0.070 $0.150 $0.150 $0.370 $0.377 $0.580 9.774%
| Record Date | Expected Pay Date | |
|---|---|---|
| January | January 31 | February 7 |
| February | February 28 | March 8 |
| March | March 31 | April 9 |
| April | April 30 | May 9 |
| May | May 31 | June 7 |
| June | June 30 | July 9 |
| July | July 31 | August 9 |
| August | August 31 | September 9 |
| September | September 30 | October 8 |
| October | October 31 | November 8 |
| November | November 30 | December 9 |
| December | December 31 | January 8 |
| Annual Top-Up | December 31 | March 17 |
| Management Fee | 1.5% of the Average Annual Gross Assets relating to the F Series and A Series units. |
| Incentive Fee | 10% of the Net Income for each unit series after deduction of the Management fee. |
| Province | Minimum investment when relying on accredited investor exemption2 | Minimum investment when relying on offering memorandum exemption3 | Minimum investment amount 4 |
|---|---|---|---|
| Alberta | $5,000 | $5,000 | $150,000 |
| British Columbia | $5,000 | $5,000 | $150,000 |
| Manitoba | $5,000 | N/A | $150,000 |
| New Brunswick | $5,000 | $5,000 | $150,000 |
| Newfoundland & Labrador | $5,000 | $5,000 | $150,000 |
| Nova Scotia | $5,000 | $5,000 | $150,000 |
| Ontario | $5,000 | $5,000 | $150,000 |
| Prince Edward Island | $5,000 | $5,000 | $150,000 |
| Quebec | $5,000 | N/A | $150,000 |
| Saskatchewan | $5,000 | $5,000 | $150,000 |
1 Accredited Investor Exemption: There is no regulatory minimum subscription amount for investors qualifying under the Accredited Investor Exemption. However, the minimum initial purchase amount established by the Manager is $5,000.
2 Offering Memorandum Exemption: There is no regulatory minimum subscription amount for investors qualifying under the Offering Memorandum Exemption. However, the minimum initial purchase amount established by the Manager is $5,000. (Only available for residents of British Columbia, Newfoundland & Labrador, Ontario, Alberta, Saskatchewan, Nova Scotia, and New Brunswick, subject to certain restrictions)
3 Minimum Amount Exemption (not available to individuals): The minimum initial subscription amount for investors qualifying under the Minimum Amount Exemption is $150,000 in each province listed above.
Trez Capital Fund Management Limited Partnership (“Trez Capital”), in its capacity as manager of Trez Capital Yield Trust (the “Trust”), temporarily suspended the Redemptions of Units of the Trusts effective 8:00 AM ET on February 15, 2026 as contemplated by the applicable Declaration of Trust creating the Trusts (“Declaration of Trust”). The suspension applies to all Redemption requests placed on or before February 15, 2026 for which payment has not yet been made and the Trusts will not accept any Redemption requests after the Effective Time until such time as the Suspension has been terminated. No payment will be made in respect of unsettled Redemption requests placed on or before February 15, 2026. The suspension will continue until the first day on which the condition giving rise to the suspension ceases to exist in the opinion of Trez Capital, acting reasonably, provided that no other condition under which a suspension is authorized then exists. In the event another condition under which a suspension is authorized then exists, the suspension will continue until the first day on which such new condition giving rise to the suspension ceases to exist in the opinion of Trez Capital and provided that no other condition under which a suspension is authorized then exists. Unless a suspension is earlier terminated by Trez Capital in its discretion and in accordance with the Declaration of Trust, if no other condition under which a suspension is authorized exists as of the date that is 180 days from the effective time of a suspension, such suspension will be terminated and the Trusts will resume Redemptions of Units in accordance with the Declarations of Trust and such processes as may be determined by Trez Capital.
Units of the Trust may be purchased through your registered Investment Advisor. To purchase units in a non-registered account directly through Trez Capital, please contact Investor Services at:
T: 604.689.0821
TF: 1.877.689.0821
E: invest@trezcapital.com
Monday to Friday, 8:30am to 5:00pm PST